A Bull or Bear market can last quite a while. Looking back since 1944, you get an interesting picture. Over time some of these drawdowns (bear market) look rather tame. The max drawdown since 2001 is -38.5 for the S&P 500 in 2008.
CAPE is “Cyclically Adjusted Price to Earnings” ratio and is a 10-year average which smooths shorter-term earnings swings and gives a longer-term perspective to market valuation. A CAPE level of 30 is the upper end of the normal range, and the level at which further PE-ratio expansion comes to a halt (i.e. further increases in market prices only occur as a general response to earnings increases, instead of rising due to “FOMO”).
No crystal ball or a predictions here, but a thought project might be to multiply your current investment balance by 0.615 and see what a drawdown might do to your current investment balance… ouch!
A secular market is a market driven by forces that could be in place for many years, causing the price of a particular investment or asset class to rise or fall over a long period. In a secular bull market, positive conditions such as low interest rates and strong corporate earnings push stock prices higher.
Conversely, Secular bear markets are the opposite—long-term price declines punctuated by occasional market rallies.
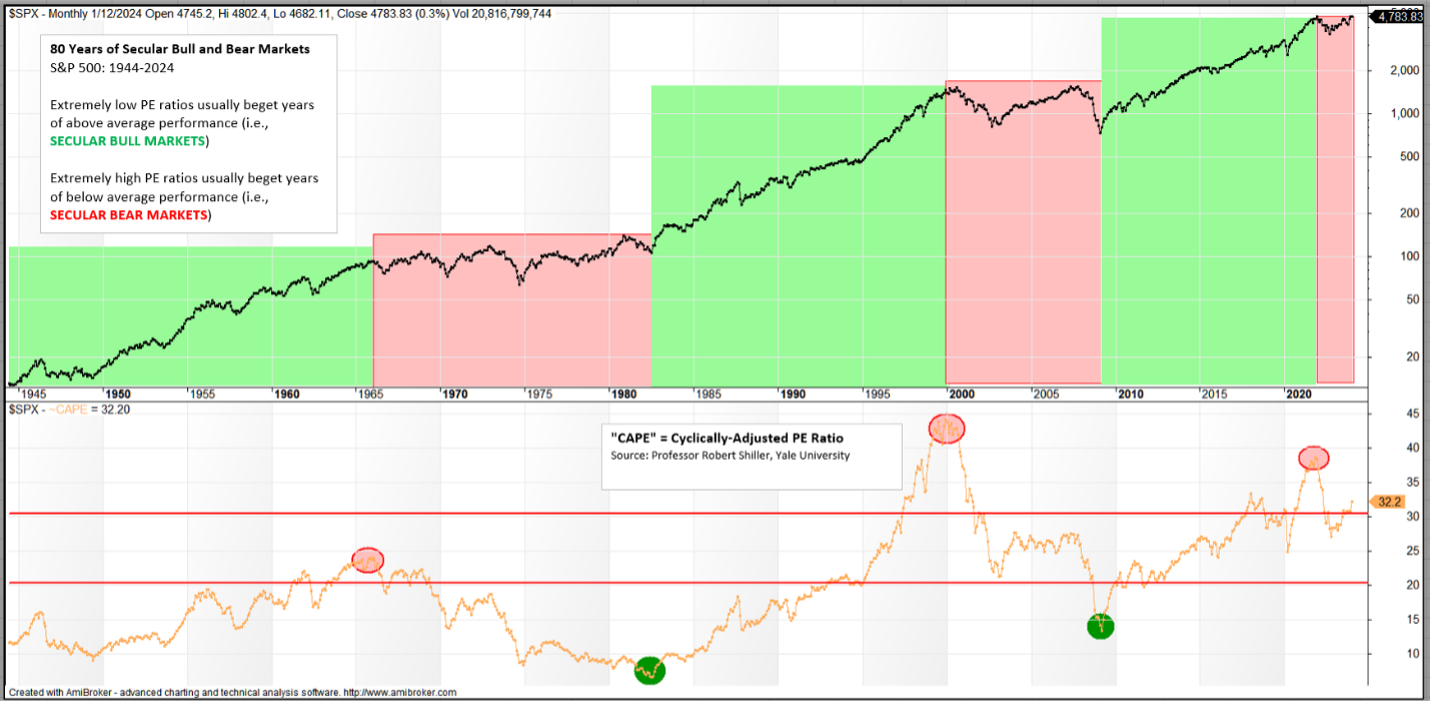 Graph courtesy of Sherman Analytics.