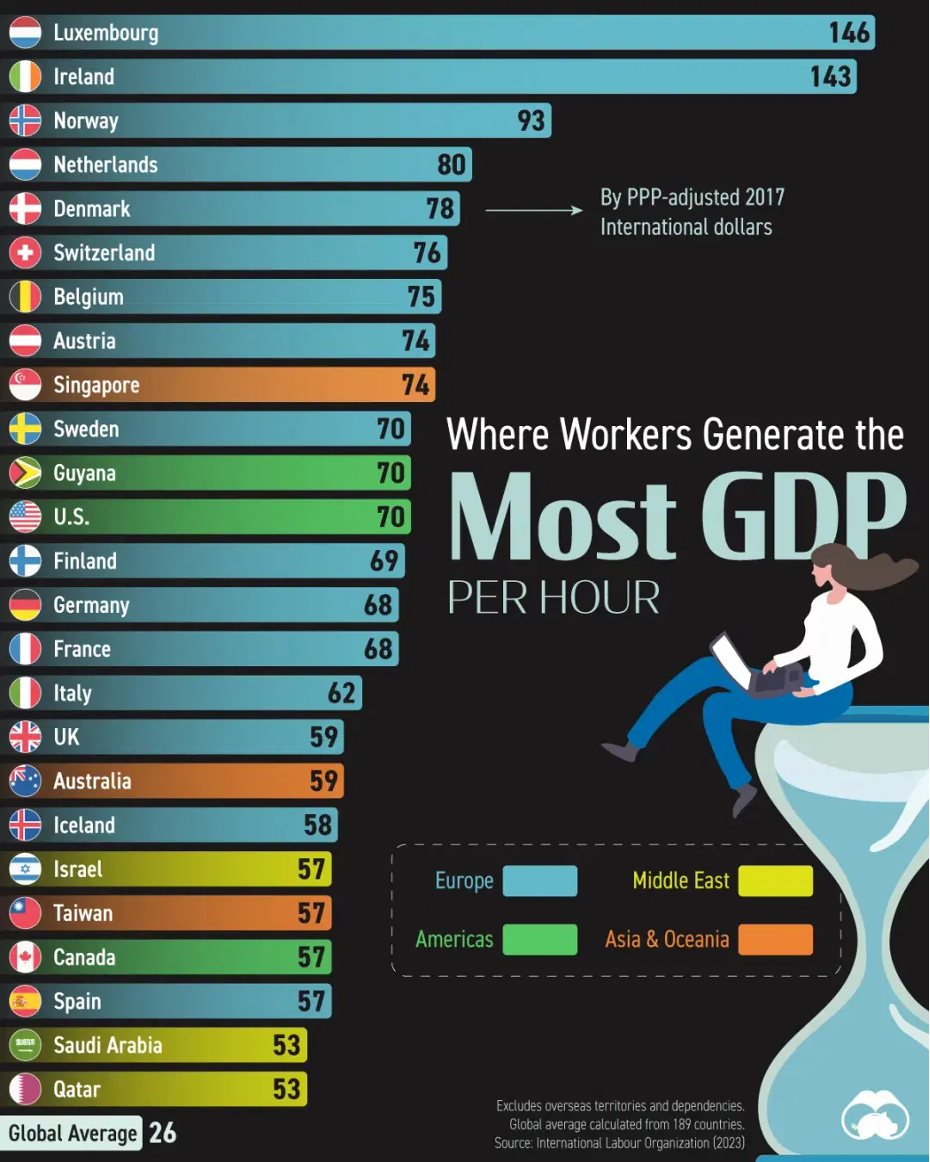
Gross domestic product (GDP) is a monetary measure of the market value of all the final goods and services produced and rendered in a specific time period by a country or countries. GDP is often used to measure the economic health of a country or region.
This chart is measured in “international dollars” (a new one for me)… a hypothetical unit of currency that has the same purchasing power parity that the U.S. dollar had in the United States at a given point in time. It is based on the twin concepts of purchasing power parities (PPP) of currencies and the international average prices of commodities. It shows how much a local currency unit is worth within the country’s borders. It is used to make comparisons both between countries and over time.
Workers in Luxembourg are nearly 3x more productive than in Qatar, due to the country’s strong financial services sector.
Europeans work fewer hours than American workers to achieve similar output levels on a per capita basis. Many rich European countries also have smaller populations, with workers concentrated in high-value-added industries (like financial services or energy), which contribute to higher per capita rates.
Relatedly, the EU also implements strong worker protections and has some of the highest mandatory paid time off days, which may help work-life balance and productivity.
Figures lie and liars figure…how the data is sliced can change these rankings.
Interesting example: In 2022 a German working hour was 1% more productive than a U.S. working hour, however a German employee produced 20% less than an American employee over the course of the year.
*Input for this post was from Sherman Analytics.

