There are many indicators out there. The inverted yield curve is one that has been a good one in predicting recessions, however we are at the longest point for the actual “recession” to hit after the yield inversion date.
But maybe it hit, and we just don’t recognize it? Or is the delay due to all the money printing that is taking place to fund our deficit spending?
I read this and found it interesting as I had not heard of the “Sahm Rule”. Then I get to the disclaimers in the write up and found the third bullet point and just chuckled…
“One important distinction is an influx of unemployed entrants into the labor pool…” … I wonder where these “entrants” came from and how they got into the country to cause this “distinction”?
What We’re Showing:
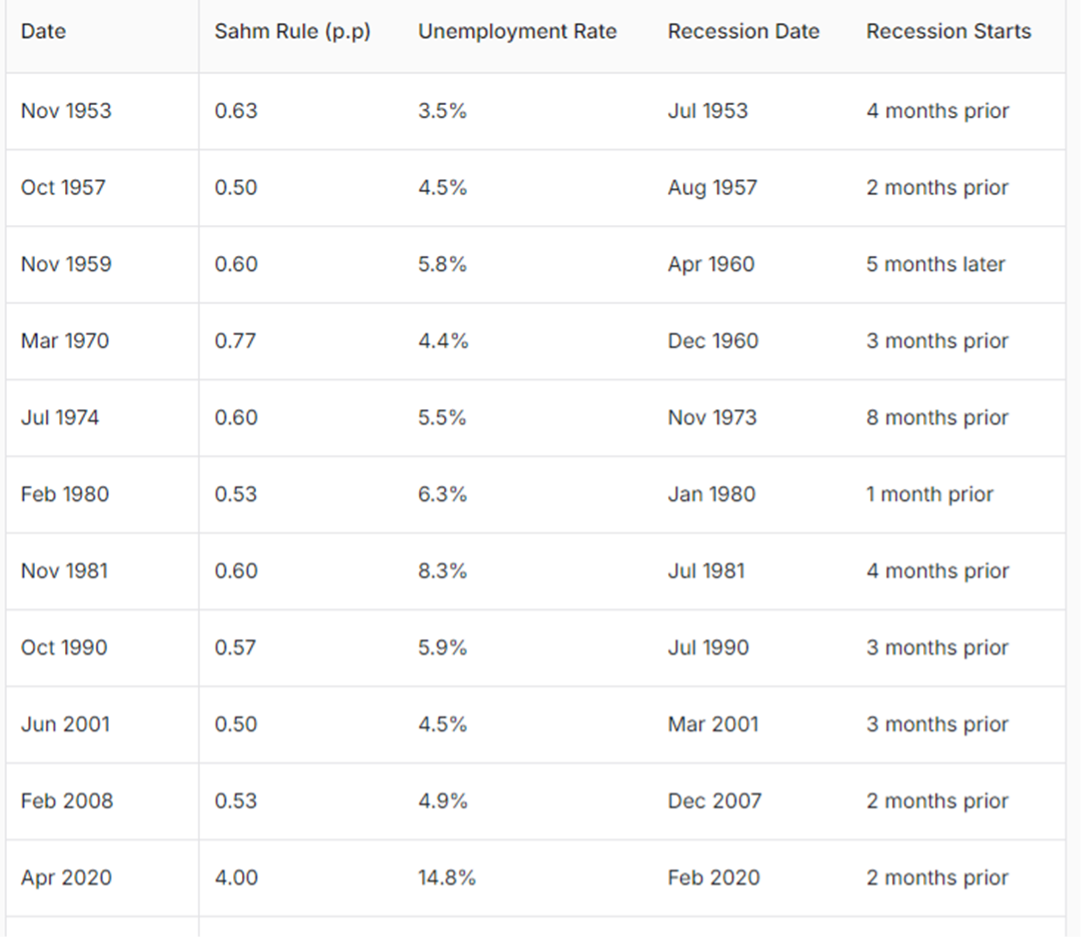
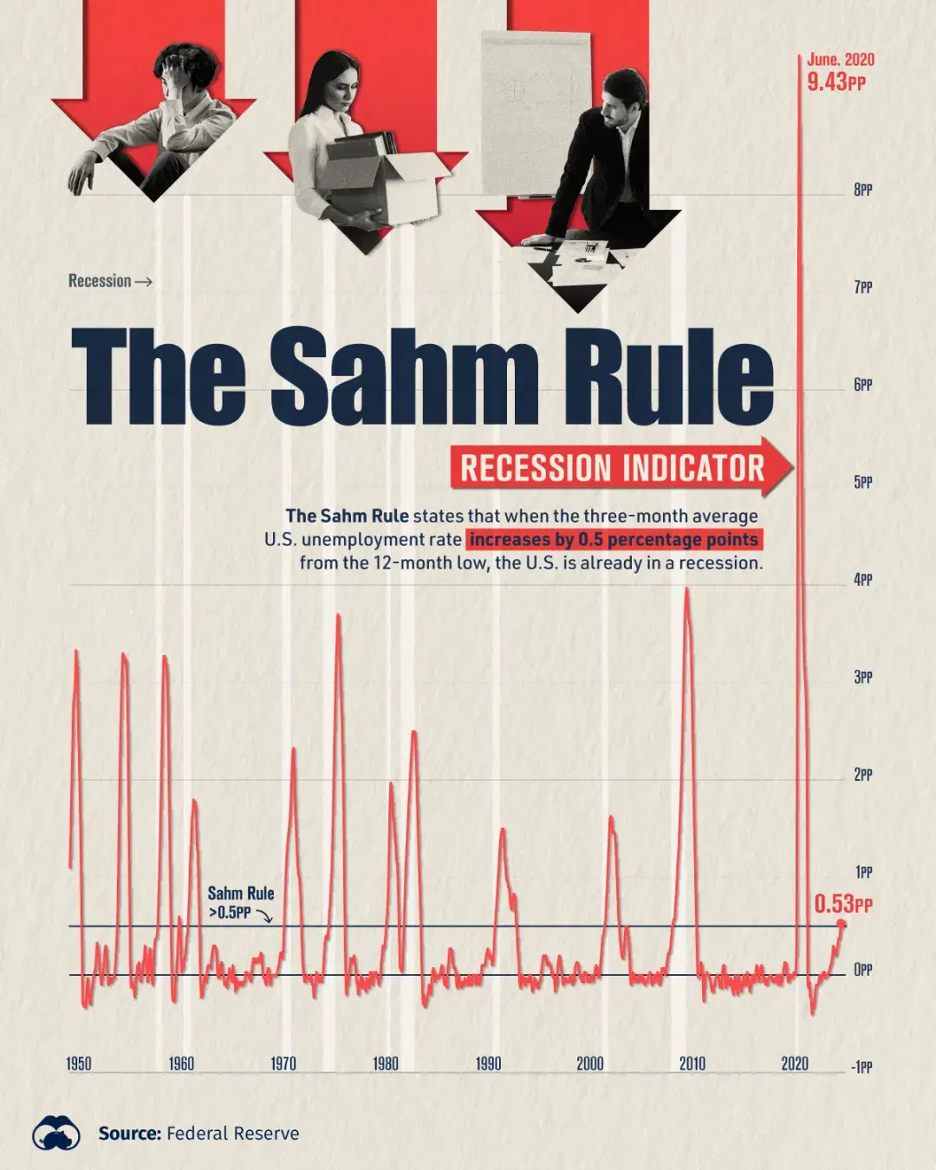
This graphic shows the Sahm Rule recession indicator since 1949, based on data from the Federal Reserve.
The Sahm Rule states that when the three-month average U.S. unemployment rate increases by 0.5% from the 12-month low, the U.S. is already in a recession.
Key Takeaways
- In July, the Sahm Rule flashed red as U.S. unemployment increased to 4.3%, up more than 0.5% from its 12-month low
- The Sahm Rule has indicated virtually every recession since 1949
- One important distinction with today is that an influx of unemployed entrants into the labor pool drove half of this increase in the Sahm Rule
- By contrast, layoffs were a primary driver behind rising unemployment in past recessions